Steel II. The price effect.
The second instalment in our steel trilogy looks back to the 2016 steel crisis, the policy causes and responses, and the lessons for today.


The steel crisis continues. In Scunthorpe, the materials (coke and iron ore) needed to keep the UK’s last blast furnace running have arrived. But the long-term plan has not yet been announced, and questions are being asked in Port Talbot, where Britain’s penultimate furnace went cold last autumn. This will rumble on, so our steel trilogy attempts to step back, and clarify some of the global forces behind the UK’s troubles.
Welcome to our new subscribers! If you missed the first instalment on steel, do take a look. We jumped back to 2001 to trace the origins of the modern era—that is, the Chinese era—of steel, outlining the strategy, including huge subsidies, that Beijing adopted. This week's story starts in 2016 with a huge glut of steel on global markets. What has been the price effect of China’s emergence as the dominant player? And what have other countries done about it?
Swimming in steel
Global trade was hit hard by the 2008 crash—bad news for countries that relied on exports, like China. In response, Beijing redoubled its support for heavy industries, including steel. Subsidies increased and by 2016 steelmakers outside China were pointing to oversupply—a glut of metal. Massively increase the availability of anything—cars, bonds, steel—and its price will tend to fall. The going rate hit a nine-year low (Chart 1).
Chart 1. Domestic steel prices – hot rolled coil

Source: Custeel (China) and CME (USA) via Refinitiv
Notes: Chinese spot quotes include VAT, CRU/CME front-month futures are ex-works and without VAT.
The prices in the chart are for hot rolled coil (HRC). It looks a bit like a massive metallic toilet roll. A coil, if unravelled, can be a kilometre in length. They are made in rolling mills – some photos and videos of the Port Talbot mill in action are here.
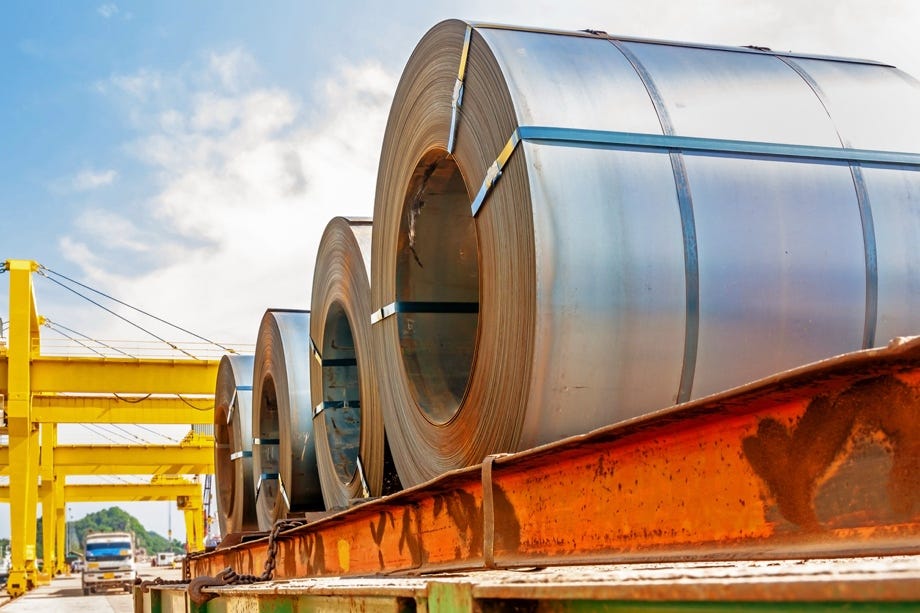
Image: Taitai6769 for iStock
This thinly pressed steel is used in “flat” products: pipes, cans, washing machines or car doors. In the UK, it came from Port Talbot. The other part of the industry makes so-called “long” products: wires and ropes, girders and railway lines—this steel comes from Scunthorpe. Both types—flat and long—are vital.
As China’s share grew, concerns mounted. One example was “rebar” steel—reinforcing bars used to strengthen concrete—which was being sold in Europe at prices far below those domestic firms could compete with. In 2014 China had supplied virtually no rebar steel – by 2016 it share was 46%.
The 2016 price crash hit steelmakers across the world. Chinese firms made huge losses. In Germany, ThyssenKrupp, the largest steelmaker, saw its profits tumble. Tumbling prices hit steelworkers too: ThyssenKrupp dropped its workers to 31 hours per week, cutting their pay. TATA Steel, which at that point owned both the Port Talbot and Scunthorpe sites, announced its intention to sell its entire UK business.
G20 to the rescue?
With employment tumbling—10,000 steel industry jobs were lost in 2016 in the US alone—steps to curb excess supply were sought. The G20 group, which had played an important role in coordinating countries responses to the 2008 crash, took up the case. The G20 Presidency rotates around the membership and that year China was host: the meetings were in Shanghai and Hangzou, with steel on the agenda. The US and China also met in Beijing, making steel part of their 2016 “Strategic and Economic Dialogue”. The supply of diplomacy was ample.
What came out of this was a new global quango: the “Global Forum on Steel Excess Capacity” (GFSEC). It brought together 33 members, including the US, China, Japan, India and the EU. The plan was to curb overcapacity, increase transparency and phase out some subsidies. It sounded sensible.
But progress was slow, and the forum satisfied no-one. While China did shut some plants, many of these were near the end of their life anyway. Moreover, closures were offset by the opening of new ones under a government-sponsored capacity swap scheme. Western members grew frustrated; Beijing accused the forum of unfair targeting and withdrew. All the G20 talk led to little action.
Tariff time
But the US did act. First up, in January 2018, came levies on imported solar panels (30%) and washing machines (20%). Then, in March, came a new 25% tariff on steel imports, with 10% on aluminium. It was tariff time.
This means 2018 was a landmark year for global trade. It was not just that the G20 plan had failed—the World Trade Organisation, the global tariff arbiter, was out of the picture too. Rather than follow WTO guidance, the US relied on national security concerns as the justification. President Trump’s new taxes become known as “Section 232” tariffs, a reference to the clause in a 1962 Act that allows tariffs when something “is being imported into the United States in such quantities or under such circumstances as to threaten or impair the national security”.
The 2025 tariffs are new, and in flux, making them hard to assess. But economists have had time to study the 2018 tariffs. What have they found? Here’s a broad-brush summary. (As ever, full references are given at the end of the newsletter)
Chart 2. US appliance imports.

Notes: US imports of HS 845011, 845020, and 845090, and 842211, inflation-adjusted with US CPI, and indexed to 2017=100. Source: COMTRADE and BLS via FRED.
Washing machine imports fell (Chart 2). Other white goods have grown, suggestive evidence that this was a tariff effect. President Biden renewed these tariffs in 2021.
The price of washing machines rose, perhaps by as much as 2 times the tariff amount. The effects spilled over to other white goods—dryer price rose too. This will have helped firms like General Electric and Speed Queen, who make washers in Louisville and Wisconsin respectively. Indeed, tariffs are estimated to have increased US employment by around 1,800. Comparing this with higher prices suggests an implied cost of $815,000 per job created.
While research tends to show tariffs are inflationary, there is a debate over who bears the brunt of higher prices. One study estimates a $51bn annual consumer cost, as price rises were passed on to US shoppers; another suggests US firms absorbed the costs, with the tariffs lowering retailers’ profits. Whether it was shoppers or firms, these costs ended up in America.
The steel pattern looks similar to washing machines. The chart below tracks steel ‘articles’—a measure that includes tubing, wiring and plate—imported into the US. There is a clear dip in China’s line. (The other countries in the chart quickly negotiated exemptions from the tariffs).
Chart 3. US imports of steel articles

Notes: US imports of steel articles (HS chapter 73). Does not include raw and semi-finished steel imports (Chapter 72), of which China is a less dominant exporter. Data are inflation adjusted following the US GDP deflator. Source: COMTRADE, IMF IFS
Deflected steel
The focus for researchers during this period was China and the US. But in the steel industry, a second round of effects was becoming evident. China was pushing out cheap steel, with the US erecting a tariff wall to stop it entering. This meant the cheap steel had to find a home. Before the tariffs, in 2017, Europe’s share of Chinese steel imports was 10%. By 2019 it had risen to 14%.
Trade-defence measures ramped up. Steps were needed to “ward off the destabilising effects of deflected steels”, according to the European Steel Association, an industry body. Brussels introduced a bloc-wide steel safeguard in 2018 (it will run until 2026). The scheme does allow duty-free imports, but caps these at historic levels. Any additional imports face a 25% tariff—the same as the US rate. Deflected steel meant that the EU had to follow America’s lead.
Steel and the state
Steel is clearly an industry that governments—whether in Whitehall or Brussels, Washington or Beijing—influence. This has implications for steelworkers, and for the rest of us, as consumers. The experience of 2018 suggests that American tariffs do have an impact on trade—Presidents Trump’s stated aim—but that a chunk of the cost is borne by America.
But 2018 is important for everyone outside the US and China too. It is a warning about the limits of global diplomacy: the effort of the G20 and WTO did little to help. And shows how the global powers can send reverberations around the world, as steelmaking firms crumbled under the pressure of deflected steel. What should small open economies—places like the UK—do? This is the question our third instalment will tackle.
REFERENCES
The 2016 Steel Glut
Guardian. Timeline of the crisis.
Guardian. Germany’s largest steelmaker in trouble.
The 2018 Tariffs: research and G20 / EU response
NPR on Steel and Aluminium Tariffs.
President Trumps national security argument.
Amiti, M., S. J. Redding, and D. E. Weinstein (2019): “The impact of the 2018 tariffs on prices and welfare,” Journal of Economic Perspectives, 33(4), 187–210.
Flaaen, A., A. Hortac¸su, and F. Tintelnot (2020): “The production relocation and price effects of US trade policy: the case of washing machines,” American Economic Review, 110(7), 2103–27.
Fajgelbaum, P. D., P. K. Goldberg, P. J. Kennedy, and A. K. Khandelwal (2020): “The return to protectionism,” The Quarterly Journal of Economics, 135(1), 1– 55.
Houde, Sebastien and Wang, Wenjun, The Incidence of the U.S.-China Solar Trade War (2024).
European Steel Association on EU steel safeguards.
Speed Queen on making Washing Machines in America.