

Steel I: China rises
The first in a three-part series. The era of Chinese steel, and the strategies—including state subsidies—that have led to its dominant position.


The UK is in the grip of a steel crisis. With full nationalisation of the Scunthorpe works—home to the country’s last functional blast furnace—on the cards, we are devoting three newsletters to steel.
The first instalment of our trilogy is a scene setter. We live, and have done for 20 years or so, in the era of Chinese steel. How did China become so dominant?
Three eras
There have been three eras of steel: British, American and, since the mid-2000s, Chinese. Other players—notably Russia and Japan—have been important, but only the UK, US and China have controlled more than half of the market. Chart 1 provides a 200-year view, with data up to 2019. China’s share in 2024 was over 55%.
Chart 1. Steel production, market share
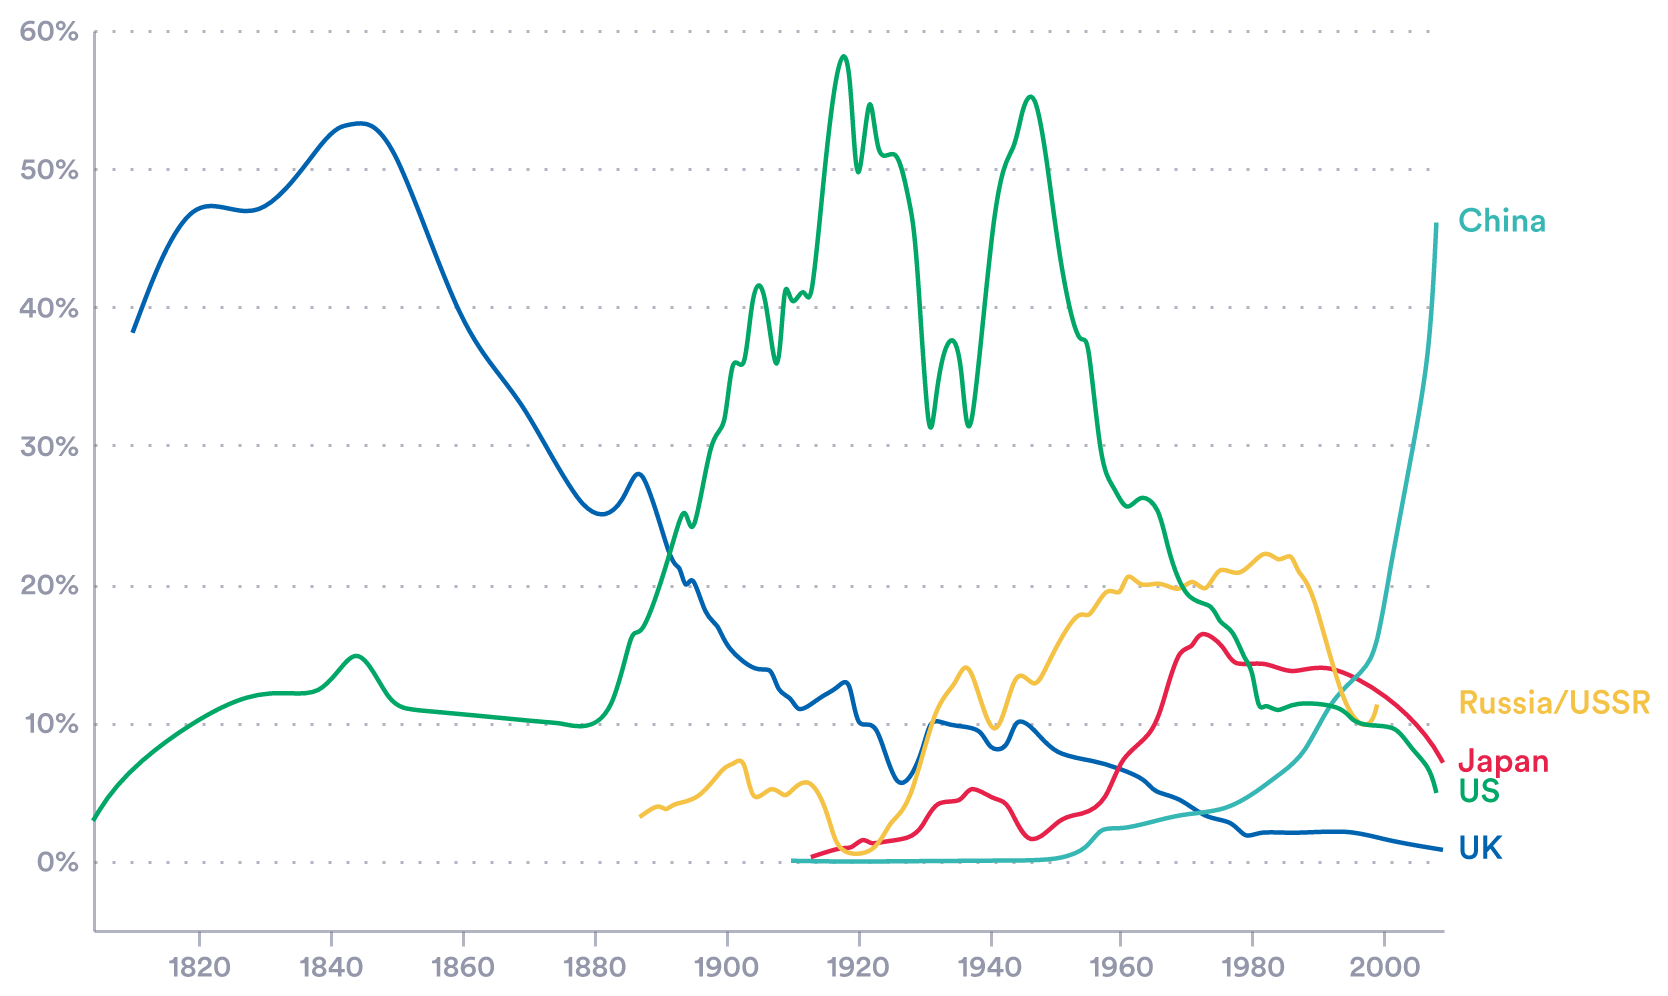
Source: Jernkontoret (2019)
Note: Before 1922, the UK series covers Great Britain.
Steel is perhaps the most important material in the modern economy. It is in everything you expect—phones, fridges, cars, aeroplanes. Strong, easy to work, and light, it is also in more surprising places. Baked Bean tins—those are coated steel. Copper coins—again steel, with a copper shell. Its presence, everywhere, puts it on a par with water, or energy. You just can’t do without steel.
The importance of steel is not new. So you might expect that the fading dominance of the UK, followed by the erosion of America’s historic pole position, would lead to discussion, research, commissions and enquiries. And you’d be right: a vast amount of ink has been spilled. From those periods clear themes jump out:
Resource Costs. The price of inputs (iron ore) and of energy, especially coal.
Efficiency. The size of steel plants, and economies of scale.
Market structure. Consolidation and vertical integration.
Market access. Tariff protection.
In the case of steel, history certainly does seem to echo—all of the above are playing out today. We’re going to skip the long history here (for interested readers some useful papers are set out in our source list). Our trilogy, and the modern era, starts in 2001.
Mapping modern steel
Today, there are over one thousand steel plants in operation. Map the world's plants, and the concentration in China is clearly visible.
Map 1: Global steel production sites

Source: Global Energy Monitor. The Global Energy Monitor’s Steel Plant Database (2024), tracks 992 plants operating across the world, with an additional 435 announced or under construction.
The steelmaking process is carbon intensive. As a result many Western economies are decommissioning most of their blast furnaces, which create ‘virgin’ (that is, new) steel, from iron ore and coke (a type of coal fuel). In their place Electric Arc Furnaces (EAFs), which recycle existing steel, are being built. This is not the case in China. Between 2000 and 2024, the country extended 411 plants, including adding many blast furnaces (Map 2). India is building new blast furnaces too.
Map 2: Chinese steel sites

Notes: Data from 2000 is not exhaustive. Some plants lack capacity data. Source: Global Energy Monitor
From steel pioneer to WTO membership
China, along with India and Turkey, is one of the countries that discovered steel. Archaeological evidence indicates that Chinese metallurgists were producing high-quality steel as early as the 4th century BCE, utilising advanced techniques such as blast furnaces and carburisation.
Jumping forward in time, 2001 is a crucial year—China joined the World Trade Organisation (WTO). This meant greater access to international markets, reduced trade barriers, and more foreign investment. What followed was a dramatic increase in steel production and exports, as China became the world's largest producer and consumer of steel. In the 1990s, China produced around 100 million tonnes of steel per year. By 2020, production exceeded one billion tonnes. Today, China is clearly the dominant player (Chart 2).
Chart 2. Raw steel production, market share

Source: World Steel (2023), authors’ calculations
Beijing’s steel plans
This did not happen by accident. The Chinese government sets out 5-year plans to guide and shape its economy. Steel has featured in these plans since the first of them, in 1953. During the Great Leap Forward period (the second plan, covering 1958–1962), steel was promoted as the foundation of strength and modernity.
Modern plans also feature steel. In 2005 steel was designated a “pillar industry”—one of the sectors Beijing thought was vital to national progress. This status brings preferential treatment: low-cost loans, easier access to land, help with infrastructure. Having been a net steel importer China became the largest steel exporter by volume in the world as early as 2006.
Some of this is down to efficiency. China’s plans tend to be large, and so benefit from economies of scale. These forces—the savings you get from being big—can be large, and can lower a plant’s cost of production. A primer on economies of scale is here.
Subsidies have played a role in Chinese steelmakers’ extraordinary rise too. One vital boost Beijing has given the industry is cheap coal. Subsidies are hard to quantify, but between 2000 and 2007, on estimate was $27 billion, the vast majority of this for coal.
The 2008 GFC intensified Beijing’s approach. China’s 12th plan (covering 2011–15) set out new subsidies for energy efficiency, R&D, and high-grade steel. Then, in 2013, the “Belt and Road Initiative” (BRI) brought more action on steel. The BRI targeted new trade routes, and also led to offshore steelmaking capacity in Southeast Asia, particularly in Indonesia. ASEAN crude steel production doubled between 2010 to 2020, primarily as a result of Chinese investment.
Chart 3. Industrial policy spending in key economies - 2019
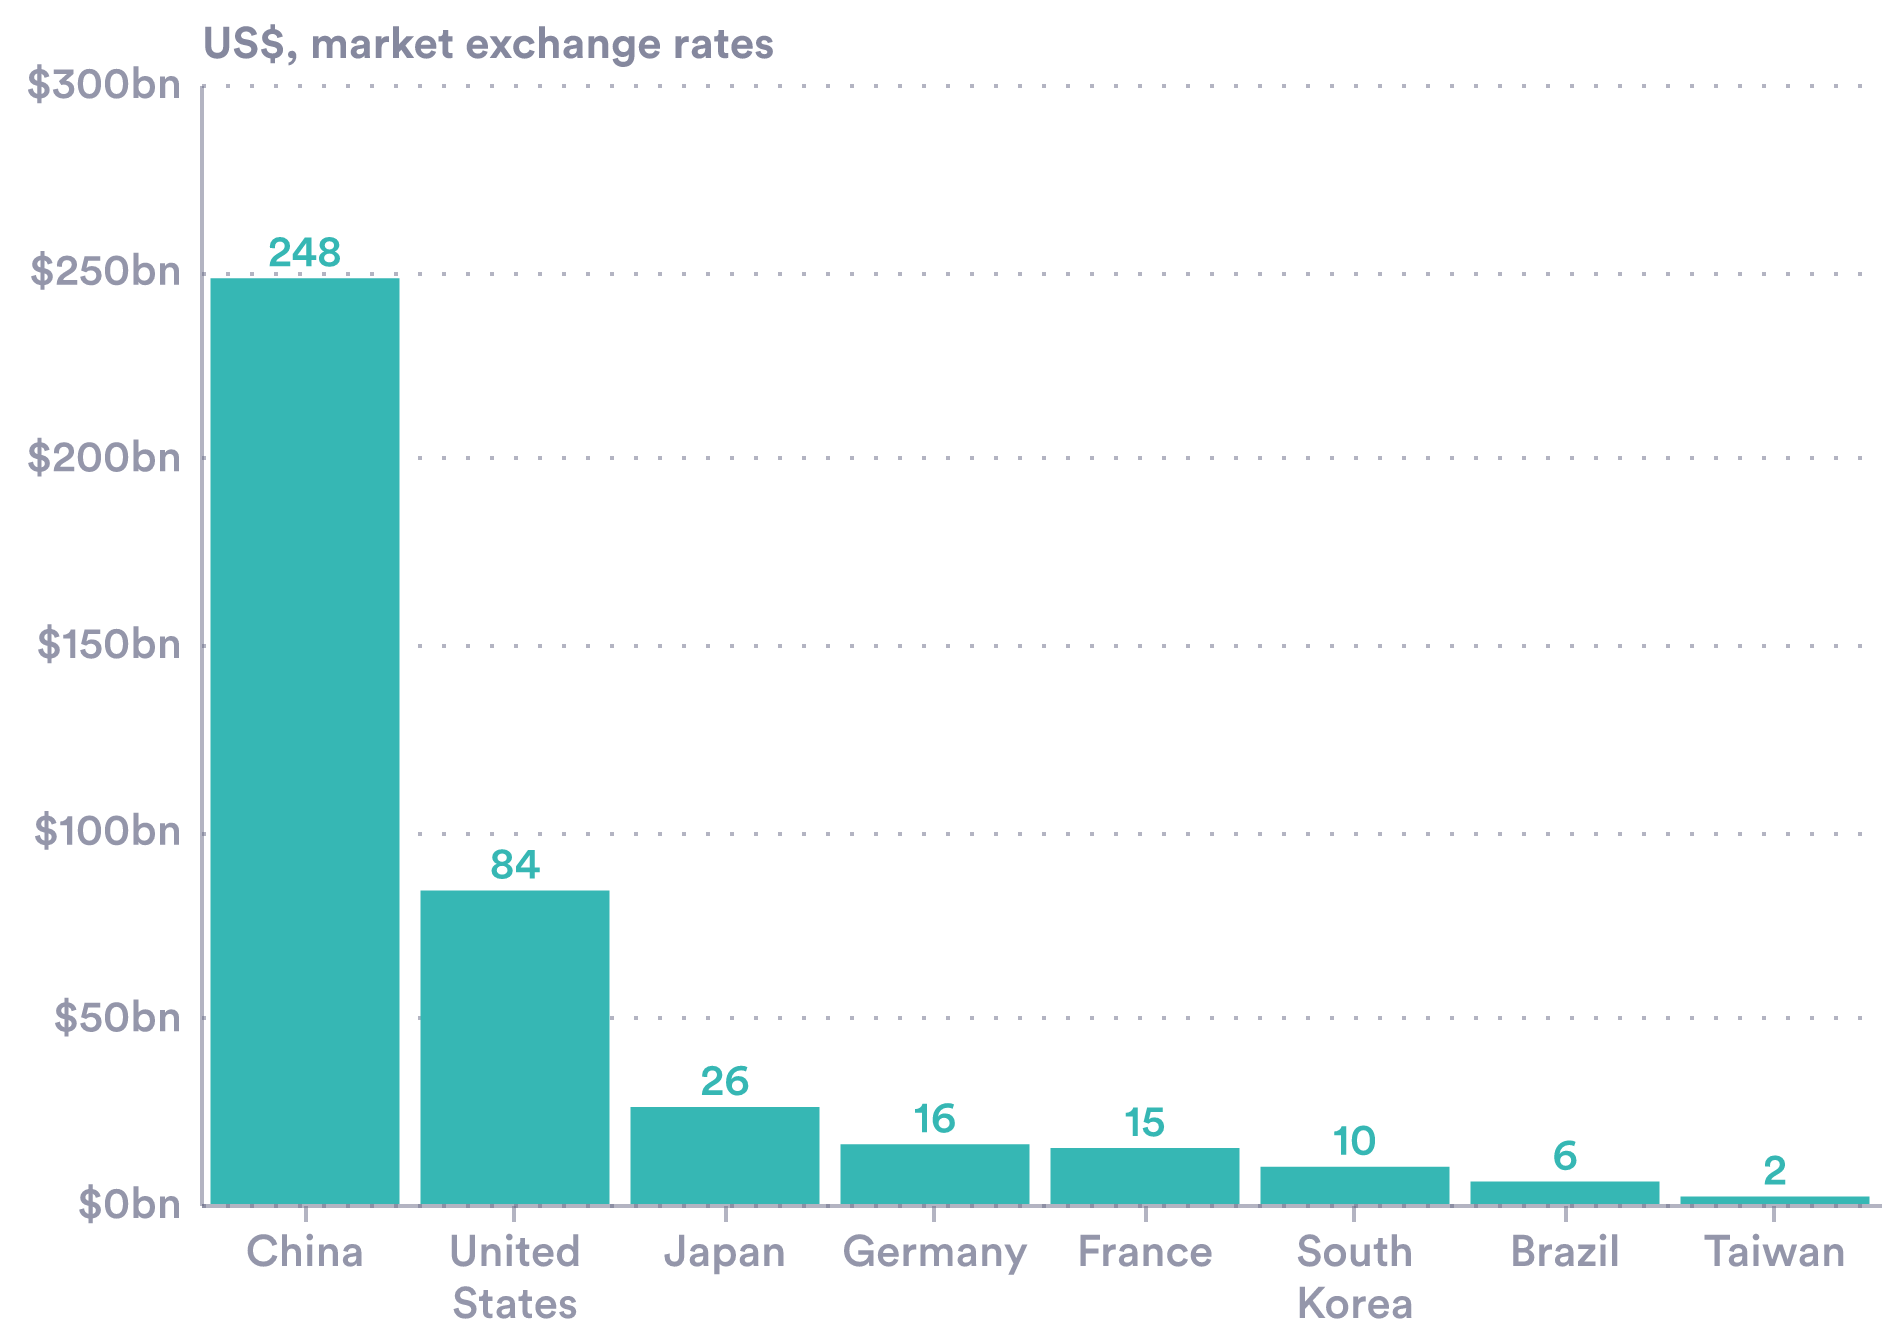
Source: Centre for Strategic and International Studies (2022).
The commitment to industrial support goes beyond steel. Recent estimates put economy-wide industrial policy spending at $248 billion or almost 2% of GDP. This is far larger than in other countries (Chart 3). By share of GDP, China spent over twice as much as South Korea and more than triple that of France or Japan.
We should expect the steel trend to continue. The team at Global Energy Monitor tracks planned plants. There are over 100 new iron and steel installations planned across China, many of which are already under construction. The G7, even taken as a group, is dwarfed by this (Chart 4).
Chart 4. Planned iron and steel installations.

Note: Multiple projects at a single plant are only included once. Source: Global Energy Monitor
Subsidies — the toolkit
How exactly does China support its industries? There are several ways:
State ownership. The simplest model is outright state ownership. This gives firms the kinds of benefits listed below: privileged access to land, credit, and strategic planning. Three of the five largest producers of crude steel worldwide, including the largest, Baowu, are state-owned.
Cheap land. Steelworks are vast sites, so land is vital. Local government can lease land at a concessional price, which becomes an implicit subsidy. The government also manages the location of private industry—the re-location payments paid to firms can function as subsidies.
Low-cost loans. The Chinese financial sector is dominated by state owned lenders. Bank loans accounted for 71% of corporate credit in 2021. According to the OECD China has one of the highest interest rate differentials in the world (that is, the difference between market rates, and state-provided rates is high). Generous loan terms help favoured sectors.
Offloading debt. Firms can convert their debt into equity shares using state-supported debt-for-equity swaps. Across China’s industries (not just steel) the programme was worth USD 330 billion in 2019. It acts as a buffer against financial distress, offering a form of state-backed protection for strategically important firms. This policy has helped steelmakers, including Sinosteel.
Tax rebates. China (like many countries, including the UK) offers R&D tax incentives. Tax and fee refunds were about $59 billion in 2019.
Input prices, including energy. As noted above, coal is a vital input, and has been subsidised in China. Again the idea is to fix input prices below market levels.
Special Economic Zones. Another way to access these benefits is to be based in a SEZ—locations which offer firms better land use rights, tax breaks, and subsidised infrastructure. The first of these zones, Shenzhen, was set up in 1980—it transformed a small fishing village in Guangdong province into a global economic powerhouse.
A new era
Any discussion of steel in the UK, or elsewhere, needs to take this backdrop seriously. We are around 20 years into the new era—the Chinese era—of steel. Beijing is the dominant player, and has plans to expand more. This shift leads to a host of questions: Do other countries use these kinds of industrial subsidies too? If so, how much is reasonable, and what counts as unfair? What are the implications for steel prices, and for the prices we all face as consumers? And what does it mean for steelworkers in the historic steel leaders, like the UK? We will try to answer these questions in our next two newsletters.
A note from the team: our newsletter is a log of personal notes on economics—the charts, facts, events and arguments that we find interesting and important. It is free and will remain so—but if you like our work please do subscribe, comment, and recommend us to a friend. We will be away next week, returning with steel part 2 after Easter.
NOTES AND SOURCES
Image: liujunrong for iStock, and authors’ illustration.
The Global Energy Monitor’s Global Iron and Steel Tracker (GIST) offers a wealth of interesting plant-level micro-data.
For the aggregate data, World Steel is the authoritative source.
How can subsidies to the steel industry be measured? This OECD report is a useful starting point.
How exactly does China subsidise its steel industry? This Wiley report presents case studies for three conglomerates.
For the very long-run, Iron and Steel in Ancient China, is a good starting point.
REFERENCES
Craddock, P. T. (1994). Recent progress in the study of early mining and metallurgy in the British Isles. Historical Metallurgy, 28(2), 69–83.
CSIS (2022), Red Ink: Estimating Chinese Industrial Policy Spending in Comparative Perspective, Gerard DiPippo, Ilaria Mazzocco, Scott Kennedy, and Matthew P. Goodman. May 23, 2022.
Dempsey, K. (2024). Steel market update column: US trade laws must be upgraded to address China’s Belt and Road Initiative. Washington, DC: American Iron and Steel Institute.
DiPippo, M., Mazzocco, A., & Kennedy, S. (2022). Red Ink: Estimating Chinese Industrial Policy Spending in Comparative Perspective. Center for Strategic and International Studies (CSIS).
Haley, G. T., & Haley, U. C. V. (2008). Subsidies and the China Price. Harvard Business Review.
Haley, G. T., & Haley, U. C. V. (2013). Subsidies to Chinese Industry: State Capitalism, Business Strategy and Trade Policy. Oxford University Press.
Islam, F. (2021, December 10). How the West invited China to eat its lunch. BBC News.
Li, W., & Yang, D. T. (2005). The Great Leap Forward: Anatomy of a Central Planning Disaster. Journal of Political Economy, 113(4), 840–877.
OECD. (2023). Subsidies to the Steel Industry: Insights from the OECD Data Collection. OECD Publishing, Paris.
Price, Alan H.; DeFrancesco, Robert E., III; & Teslik, Adam M. (2024). Shell Game: Case Studies in Chinese Steel Subsidies. Washington, DC: Wiley Rein LLP.
Wagner, D. B. (1993). Iron and Steel in Ancient China. Handbook of Oriental Studies, Section 4 China Series, Vol. 9. Brill Academic Publishers.
World Steel Association. (2023). World Steel in Figures 2023. Brussels: World Steel Association.
Wu, Y. (2000). The Chinese steel industry: Recent developments and prospects. Resources Policy.
Zheng, C. (2024). China’s largest listed steelmaker breaks ground on zero-carbon factory. China Daily.